
Marketers are constantly tasked with making sure marketing dollars are being put to best use to have the most company revenue impact. We not only need to know how our marketing efforts are performing through website traffic, content downloads, blog subscriptions, SEO, social media, and lead generation, but also how these efforts are transforming into revenue.
HubSpot's Revenue Reporting (through current contacts/companies reporting) can help you report out on the actual revenue that your marketing generates.
Part 1: What is revenue reporting in HubSpot?
In a nutshell, revenue reporting helps you see the financial ROI for your marketing efforts, helping you better make decisions on how to invest your marketing dollars.
Here are some basic setup requirements available through HubSpot documentation:
- As an Enterprise customer, you can run a Revenue Report using a Contacts or Companies Report.
- If you have HubSpot CRM, there is no setup necessary.
- If you have Salesforce, make sure you have Account Sync & Opportunity Sync turned on.
- If you have another CRM, you can use the Deals API to set up your custom integration.
Part 2: Why use it?
By using revenue reporting, you can see what sources are generating the most revenue and build upon that success. If PPC is generating the most revenue, maybe increase your budget, tweak messaging, add additional products to ads and then continue to closely monitor success..
- Use Case #1: Which customers are spending the most money on your products or services?
Send special thank you messages or special offers for new services. Ask for referrals. Invite them to upcoming events to meet with you in person to gather feedback. You can also gather information on what caused them to first come to your site and use this data to turn prospects into paying customers. - Use Case #2: What type of content is most important to your customers and how much revenue is it generating?
You can use this reporting to measure the ROI of your content beyond downloads and clicks. What revenue does your new white paper really bring in? You will need to come up with a way to attach revenue to certain pieces of content to help you really generate what assets are the most successful in terms of revenue. You can then allocate resources accordingly. Keep in mind that revenue is important but you also need to look at the leads that are being generated that may convert to true revenue over time. - Use Case #3: What marketing campaigns are generating the most revenue?
You may need to report monthly, quarterly or annually on how your marketing campaigns are performing. What is working and what is not? How are your email campaigns working? Are you social media efforts paying off? What about PPC?
Part 3: How do you use it?
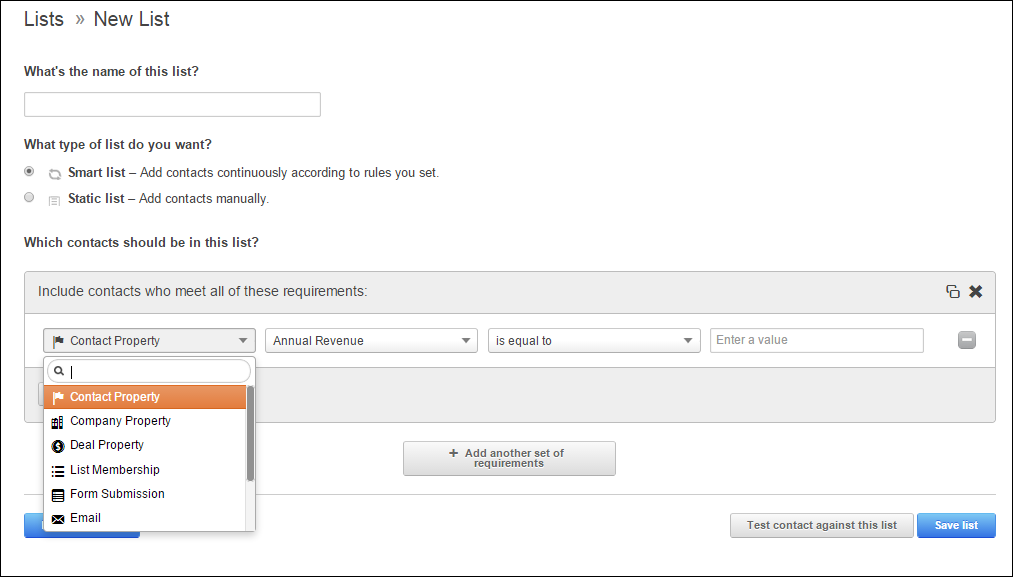
Create a Customized List or Use All Contacts:
- Create a specific list of contacts to analyze companies and their activity through the list tool. You can create a static or smart list depending on if you want a snapshot of what has happened up to now (static) or would like dynamic lists of contacts as they meet a set criteria. You can also choose to analyze all contacts in your database,
- Set your list rules depending on what you want to measure (refer to the use cases above for examples). Do you want to look at a certain industry? Company size? Annual revenue?
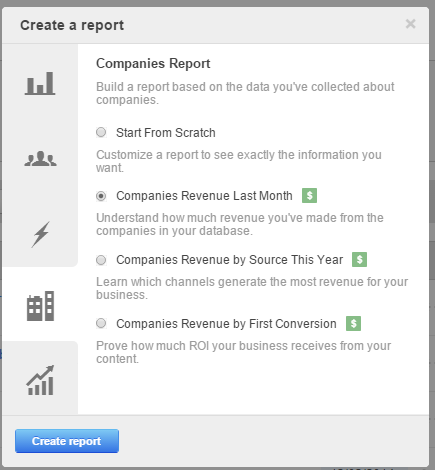
Use an Existing Built-in Report:
Go to the Report section, select create a new report, and one of the options will be Companies Report. Now you can build your report. Some common built-in reporting options (called recipes): Companies Revenue Last Month; Companies Revenue by Source This Year and Companies Revenue by First Conversion currently exist for fast reporting.
Create a Customized Report:
- Go to the Report section, select create a new report, and one of the options will be Companies Report. You will notice that you can report on either ALL CONTACTS or you can SELECT A SPECIFIC LIST,
- Once you've have decided on your list, select a time period to analyze - This month to date? Overall? Last six months? You can also customize a date range. Also select how you want to plot companies by any date field that you have in your database, first conversion date, create date, last modified date, etc.
- The next optional field is to break this report down by the following companies property. You can deep dive into what you want to see. For instance, you may want to see how many companies/revenue came from your marketing outreach and source (social media, PPC, direct traffic, email, etc.)
- Now for revenue. The final field allows you to calculate the total value of a property in the Companies Report. By selecting Salesforce Total Revenue, the report will pull in the total revenue of your graphed companies.

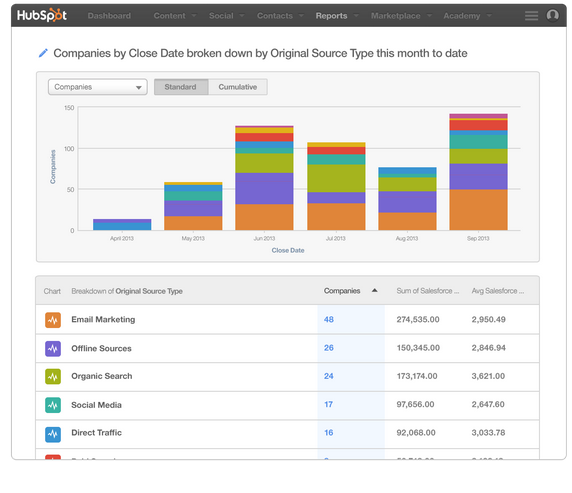
Part 4: What does my report show?
Your report will show you—by actual revenue—which marketing efforts are the most successful as in which channels are the most lucrative for your business. You can click on the companies per source to see a breakdown of actual company names.
Now you can use this report to build on successes. Since email marketing performed the best in this scenario, you will want to analyze what types of email marketing you did during this time period. Was it around new products? What was the message? You can use this report to see how to improve the next month, quarter, etc.
And maybe PPC is not performing as well, do you want to cut your budget here a little or try to test different messages and offers.
 . *images provided by HubSpot Academy
As you get more familiar with revenue reporting, you can further drill down into your data to show how the most revenue generating companies first came to your site. What did they first download? Did they attend an event? Again, build upon what is working by truly measuring the ROI that your marketing efforts generate.